 |
 |
 |
Lesson 7How Can I Quickly Make More Money With What I Already Have?Part 3: The Listings WindowThis mini-series has covered some awesome techniques you can use to increase your profits on any product. Now, weâre going to take it one step further and look at how you can find the answers to your own unique questions. Today, Iâm going to reveal to you the window that allows you to truly customize your research. Youâre different, and no one else has the same background or experiences you have. You have a unique business with unique offerings and unique goals, so why should we assume that you have all the same research questions as any other eBay business? Well, youâre exactly right. And the Listings Window is going to allow you to find the answers to your unique research questions! Introducing the Listings WindowWeâve actually already looked at the Listings Window. When we filtered our report for accuracy we used this window to find those listings we didnât want included in our results, remember? But now, Iâm going to show you how to use this report to find answers. Go ahead and open up your Filtered Earbuds report, and weâll get started! Now, before we begin, I want you to scroll to the right within this window and see just how much information is here at your fingertips. Thatâs crazy, huh? It really shows you how much power HammerTap gives you. Quite honestly, the first time I ever looked at this window I was slightly overwhelmed. I thought it was awesome there was so much information, but how it the world what I supposed to actually make it useful?! Well, when you come into this window, you want to have a question. If you have a question, you can easily read the data to find your answers. So, what question do we want answered for our Skullcandy earbuds? Well, letâs imagine that Iâve decided Iâm going to go with an auction-style listing. Weâve already discovered that Iâll get the highest price if I end my listing on Sunday, but what time on Sunday will get me the highest price? (When we looked at the Findings chart and the Summary Window we examined ending times, but now weâre looking for the time that is best specifically for Sunday.) Sorting the DataAs we set off on our quest for answers, letâs first review how to sort the data. We talked about this briefly in a previous lesson, but I want to review it real quickly here too, just to make sure weâre on the same page. Pick a column, any column, and click on its header. By clicking on the column heading, the data is sorted in ascending or descending order. (Notice the way the little arrow is pointingâthat tells you which way the data is sorted.) You can sort the data in this window by any column heading and also drag and drop columns into any order, making it a snap to compare columns to each other. And while you may think thatâs cool⦠just wait, it gets better. To find out which time on Sunday will be best to end our auction, we want to compare the End Day, End Time, and Total Sales columns. Instead of just plopping them next to each other, weâre going to make the data even easier to look at.
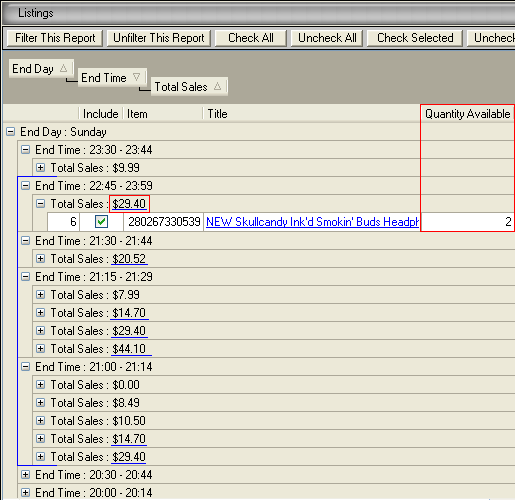
Hereâs what my Listings Window looks like after all those steps (your window wonât have the colored outlines⦠I added those):
After you expand each of the times to reveal the total sales, look for a time of day with a number of listings that sold at higher than average prices. (Remember that our overall ASP is $12.13.) Trying to find a specific hour of the day is usually tricky and unreliable, so instead, focus on find a more general time of day that will return a higher price. Look through your report or the picture of mine and see if you can spot some above-average total sales. If youâre looking at my window, youâll notice that the second listing down has a price that seems a little high ($29.40, outlined in red). If you see prices youâre not sure about, go ahead and click the plus sign to expand it out and look at the individual listing(s). Next, check the Quantity Available column (also in red). Youâll see that in this case, the total sale was indeed $29.40, but two sets of earbuds sold, each selling for $14.70. I went through and checked all of the times on Sunday and found the highest concentration of above-average prices within the times I bracketed in the above graphic. Iâve underlined in blue the listings that sold for higher than average. From these sales, we can conclude that listing between 9 p.m. and midnight will get us the highest price for our earbuds.
Once youâre finished looking at your sorted data, you can return to the normal Listings Window view by dragging the column headings up until you see the black X appear. Then just let go of the header and it will disappear. Do this with each of the column headers and youâll be back to your normal Listing Window, ready to find answer to more of you questions. Other questions you might ask include:
Really, it just depends on the extent of your creativity. You can sort the data to answer dozens of questions, so what do you need to know? Assignment #7: Answer your own questions! Youâve now learned all the techniques for quickly optimizing your listings! Way to go! Now, I want you to pull it all together for one of your own products. Run a new Product Search (check for accuracy!), and check the Findings Window (both the chart and the question reports), the Summary Window, and the Listings Window for ways you can optimize your listings to maximize your profits! You might find some surprising new ways to pull in those high-paying buyers. CONGRATULATIONS! Youâve not only finished this session, but youâve also finished our mini-series! Now, weâre going to move on to ways you can increase traffic to those newly optimized listings! Stay tuned for Lesson 8, and donât forget to send your questions to our support team! Look for Lesson 8 in your inbox in a day or two. Or, if you can't wait, move forward to Lesson 8 right now. Or, return to Power to Profit Tutorial Home Page |
|||||
 Itâs crucial that you remember all times you
see within HammerTap are Pacific Time. Because eBay is based in
California, all their times are recorded in Pacific Time regardless of
where the seller or buyer is located. Make sure you do the math if you
live anywhere other than the Pacific Time Zone!
Itâs crucial that you remember all times you
see within HammerTap are Pacific Time. Because eBay is based in
California, all their times are recorded in Pacific Time regardless of
where the seller or buyer is located. Make sure you do the math if you
live anywhere other than the Pacific Time Zone!