 |
 |
 |
Lesson 3: Reading the Results WindowHi Protégé, Today´s session gets right to the meat of what your research tool is all about—answering the questions WILL MY PRODUCT SELL? and HOW MUCH MONEY CAN I EXPECT TO MAKE? Have you ever listed an item for sale and wondered, "Will this item sell?" or "How much money will I make?" or "How can I best list the item to increase my chances of selling and increase my profits?" Of course you have—that´s why you´re here. Your research tool answers these questions with the Results window. Note: Before continuing with this lesson, please do a search for the product you would like to list (either Keyword or Category), then filter your results (see Lesson 2 for complete instructions). Once your Results window appears, you can refer to it as we go along. Introducing the Results Window!Now that we know how to do Keyword and Category searches and filter our results, we are ready to dive into the results and begin optimizing our auctions.
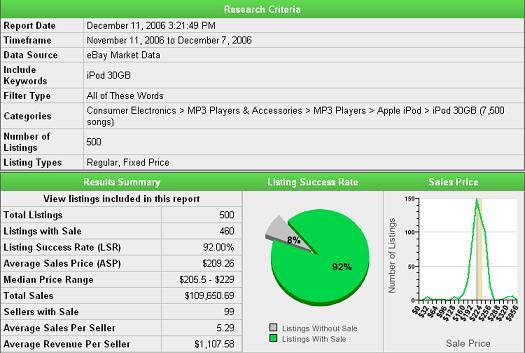
The Results window consists of three sections: Research Criteria: This section lists the criteria you searched with.
Results Summary: This section is a table of results about your research. It is an excellent resource for quick information.
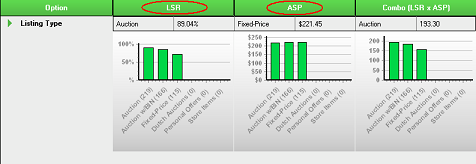
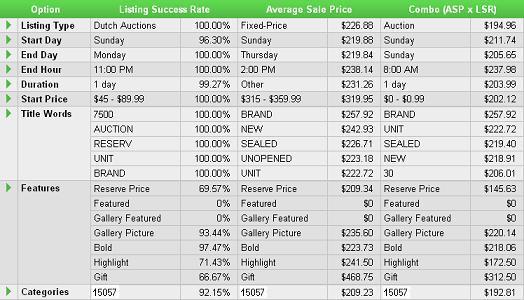
Option Table: This section is a table of options available for use in a listing and their success in terms of LSR, ASP, and Combo.
When it comes to your listings, these factors are all the things that will affect the outcome of the final product. This is done through optimization. Optimizing your listing is done by selecting the key listing features that bring you both the highest success rate and highest selling price. After today´s lesson, you will:
I remember the first time I opened this research tool to find out about a product I wanted to sell on eBay. My first thought was, "Whoa, what are all these numbers?" But over time, I have quickly learned how to research my products and optimize my listings. One of the secrets to becoming a more powerful seller is that you need to understand the importance of both LSR and ASP in the Results window. Let´s look at the first option together—Listing Type. What listing type should you use for your product? Well, that depends. If you want to sell more products, look at the LSR column and find out what listing type will bring you the greatest sales success. Or, if you want to increase your profits, look at the ASP column to find which listing type will give you the most money. If you weren´t sure where to begin reading these reports before now, these columns are a fantastic, simple place to start.
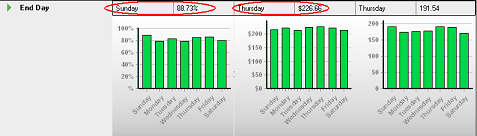
When you see the LSR and the ASP columns, think of them this way: LSR (Listing Success Rate): The numbers in this column tell you the elements and features that are likely to boost your chances of making a sale. You´re looking for the highest percentage in this column to decide which listing element will give you the best chance of selling. ASP (Average Sale Price): The numbers in this column tell you the elements and features that are likely to boost your ending sales price. You´re looking for the highest dollar amount in this column to decide which listing element will give you the best selling price. Go ahead and look at the other listing features that will boost your success rate and profits. Looking a Little DeeperNow let´s see what else the Results window has to offer. Let´s find out which day is the best to end your auction. To do this:
In this example, the LSR for Sundays is the highest at 88.73%, but the ASP for Thursdays is the highest at $226.66. Even though more auctions closed on Sunday than on Thursday, auctions on Thursday closed with a higher sale price. Depending on which factor is more important, you may choose to close your auctions on Sunday or Thursday. Examining the success of other factors will also help you decide which is most important (we will examine this later). What Do the Numbers Mean?Below are some common questions about what the numbers mean: Is X% a good success rate? People often ask whether 50% or 40% or 60% is a good success rate. The answer isn´t a simple yes or no. If you can list the product more than one time and still make a profit, the answer is yes. If your profit margin is too narrow to list the product multiple times, then the answer might be no. It really depends on your situation, the price you´ve paid for the item, and how much your research says you can make on it. Should I follow the best LSR (Listing Success Rate) or the best ASP (Average Sale Price)? The research in your research tool has been organized to fit two basic strategies: selling a higher volume (LSR) or selling at a higher price (ASP). You should follow the one that fits your strategy. For example, if you have just purchased 100 widgets at a bulk rate, you´ll want to do whatever helps you move more merchandise in a shorter time period. You know that if you sell more items, even if they´re sold for slightly less, you´ll make more money in the long run. In this case, you´d want to take advantage of the listing elements with the best LSR (Listing Success Rate). If, on the other hand, you have a unique item, you´re probably less concerned with how quickly it sells and more concerned with how much money you can make for it. In this case, you´d want to implement the listing elements that had the best ASP (Average Sale Price). What is in the Combo column? The Combo (ASP x LSR) column lists the "happy medium" (the options with the highest combined LSR and ASP). Though the average sale price in the LSR column may be lower than the one in the ASP column, recommendations in the Combo column have an overall greater chance of yielding both a high sale price AND a high listing success rate. Five Minute ResearchNow you can see that in five minutes, I could look through the Results window and find answers to the following questions:
Create a combination of these options and your success will be higher than the average and your sales price will also be higher than average. That´s the reason you got this research tool, right? To sell more and make more—and this is exactly how you do it! Assignment #3: Whip up your own batch of auction optimization Now YOU research an item or two you´re thinking about selling. Run a Results report and determine what your likelihood of selling is, what price you can get, and whether it will give you a profitable return on your investment when ALL your product costs and seller fees are considered. After that, look through the rest of the Results window to find an optimal combination of listing features that will result in the perfect product listing. Be sure to look at ways to increase your sales success rate (LSR) and your profits (ASP). Note: Don´t forget to narrow your research results like we discussed in Lesson 2. This will give you more accurate information as you start making executive decisions. Once you have whipped up your product, you´re ready to list and sell! CONGRATULATIONS! You´ve completed Lesson 3. |
|||||
 Follow the recommendations in this column if you have a high volume of items and you need the best chances to sell them. You may have to sacrifice slightly on price here, but do the calculations to figure out if you will make more money in the long run if you can successfully sell more product.