 |
 |
 |
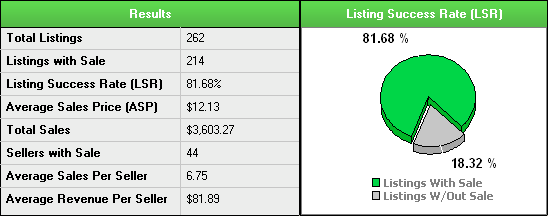
Lesson 5How Can I Quickly Make More Money With What I Already Have?Part 1: Where to StartOne of the #1 reasons HammerTap is such a valuable eBay market research tool is because it shows you how you can make more money from the products youâre already selling. There are a lot of ways that HammerTap helps you optimize these listings, so many in fact that itâs going to take us three lessons just to get through them all! This is really exciting stuff, so hold on to your hat, because youâre going to be blown away by the information HammerTap puts right at your fingertips! Introducing the Findings WindowIn our last lesson, we worked a lot with the Category Search, which is a great tool for looking at the market as a whole. However, today weâre moving back to our Product Search. So, do me a favor and letâs open up our Skullcandy earbuds report. Remember, we want the filtered one because weâre going to start making decisions based on the results. Your report should be named something like Filtered Earbuds (if you need a review on opening a saved report, check out Lesson 3). The first screen you see when you open your report is called the Findings Window. This is the most basic results screen, and itâs a great place to start looking for answers. We first want to take note of the LSR and ASP. We talked about these a little bit in Lesson 4 (remember, LSR = Listing Success Rate and ASP = Average Sales Price), and weâre going to use these numbers as benchmarks as we figure out how to sell better. Always remember that LSR and ASP are averages. That means there are plenty of sellers both above and below these rates. You want to figure out how to sell above them, and thatâs where HammerTap comes in. So, letâs look at my LSR and ASP.
For our Skullcandy earbuds we have a LSR of 81.68% and an ASP of $12.13. Weâre going to use these numbers as a starting place.
So we can use our LSR and ASP averages as a starting place, but we want to sell better than that. Selling better really depends on what we want to accomplish and our selling strategy. (Donât freak out on me⦠I know selling strategy may sounds a little intimidating, but I promise itâs actually really simple, and youâll probably have yours figured out before Iâm even done explaining them.) Selling StrategiesHere at HammerTap, we realize that there isnât always one right answer. We understand that each of you has a very unique business based on unique backgrounds, experiences, products, and goals. And since you are each so very different, it wouldnât be correct if we simply interpreted the data for you and said, âOk, hereâs the one right answer.â I mean, except for math and science problems, how often is there really only one right answer? So weâve based the answers youâll see on three different selling strategies. Scroll down in the Findings Window and youâll see a chart that looks like this:
Check out all the options this chart has! Itâs going to tell you exactly what you should do for each of these choices. (Just imagine how much easier this will make your life! Now, instead of guessing youâll have easy answers based on facts!) Ok, but hereâs the catch. Notice that there are three columns, which each have different answers. Well, which one do you follow? Thatâs where your selling strategy comes in. Each of the columns represents a strategy, and the right answer for you will be the column that represents the strategy youâre running your business by. LSR: Listing Success Rate The first strategy is a LSR, or Listing Success Rate, strategy. This is a high volume, low price strategy. If I had 1,000 sets of earbuds that Iâd bought at wholesale, I would want to go with this strategy. Iâm interested in selling my product as often as I canâgetting it out the door the first time, every time, as often as I can. This is because I donât want to be stuck with left-over inventory, and I also donât want to spend the time and money it would take me to relist my items. Because I bought in bulk, I probably got a decent discount on the product, and Iâm more likely to be willing to accept a lower price. With this strategy Iâm looking to maximize my listing success rate. This column is going to give me those answers that will help me sell my product more often, which is exactly what I would be looking for. ASP: Average Sales Price The next column contains answers for the ASP, or Average Sales Price, strategy. This strategy focuses on low volume and high price. This would be my strategy if I had a smaller number of earbuds. For example, letâs imagine that I bought 5 pairs of earbuds on sale at Best Buy. I got a deal, but it wasnât amazing. In this situation, Iâm going to be a little more price-sensitive because I have a higher cost of inventory per item, and I only have five chances to make my overall profit. Iâm willing to list my product a couple times if it means Iâm going to get a higher price, and Iâm interested in those options that are going to increase the price I receive on my earbuds. This column helps me do just that. It shows me exactly what I need to do for my listings if I want the highest price. So, instead of spending all my time listing five items trying to figure out what works, and ending up with wildly varying prices, I can follow this column and know what has the greatest chance of consistently working. Combo (LSR x ASP): Balanced Strategy This is the final strategy, and you can probably guess that this one offers you the best overall option. We recognize that there are often times when you want to both sell your item quickly and get a high price. This column makes it easy for you to find the best âmiddle-of-the-roadâ answer.
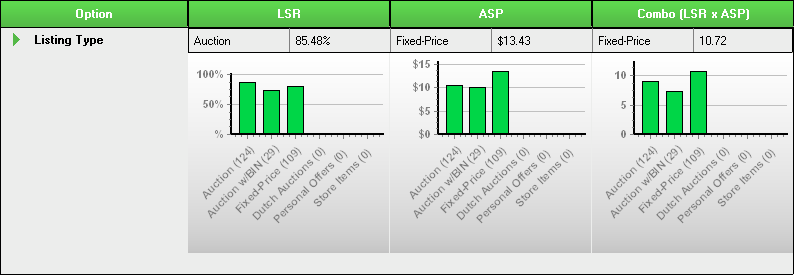
So, have you figured out your strategy yet? Good job! Now, letâs take a look at some of the answers this chart gives us. The Findings ChartThe first option on our chart is Listing Type. Simply click the green arrow next to the title and it will expand out.
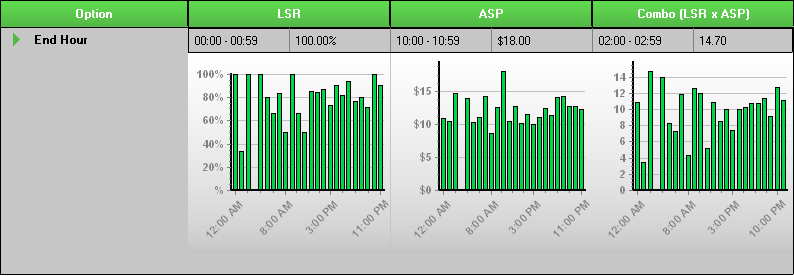
We can now see graphs depicting the answers based on each strategy. First, letâs check out the LSR column. With this strategy, we will have the highest chance of success using an auction-type listing. This listing type brings our LSR from 81.68% (our average) to 85.48%. Next weâll check the ASP column, where we can see a very clear and distinct peak in the chart, indicating that the 109 listings that used the Fixed-Price format had a much higher closing price (the numbers in parentheses next to the listing types specify the number of listings that used that format). And finally, the Combo column also indicates that Fixed-Price is the best choice. Do you see how easy that was?! Now, I want you to check out the Start Day and End Day options on your own. What are the answers for the different strategies? Next, we have the End Hour section, which Iâm going to look at with you.
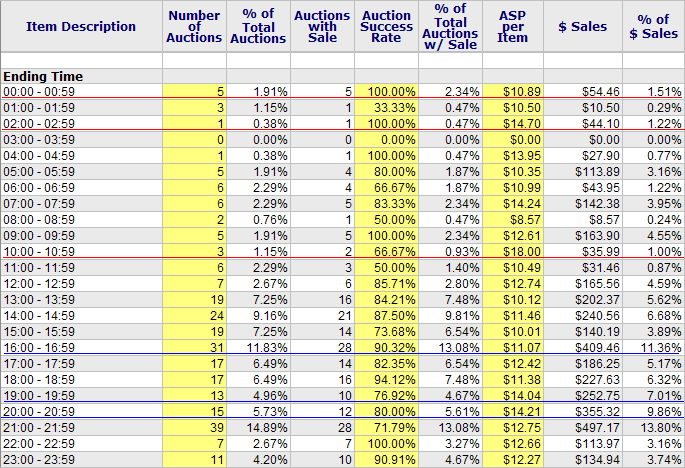
Here youâll notice something interesting. In the LSR column, it tells you that the best time to end is between midnight and 1 a.m., and in the Combo column, it recommends ending between 2 and 3 a.m. That seems a little odd, doesnât it?
We
need more information! So, letâs go to the Summary
Window. Simply click Hereâs the table from my results (with a few of my own underlining edits):
Ok, so the first time underlined in red (00:00 â 00:59) was the time recommended by our LSR strategy. Notice the first yellow column (Number of Auctions). There were only 5 listings that closed at that time. In other words, the 100% success rate is based on only 5 listings! That doesnât sound very reliable or proven to me. Five listings isnât a very large sample size, and you canât rely on results that havenât been proven. However, if I had quite a few products (remember, LSR is a high volume strategy), I could test the ending time and see if it worked for me. But if I wasnât willing to take that risk, I would want to find another, more reliable time, to end my listings. The next time underlined in red was the Combo columnâs recommendation. Can you spot the problem? Only 1 listing! Thatâs like flipping a coin! Definitely not reliable. And finally, letâs check our ASP strategy ending time since weâve been having problems with the other two results (the third time underlined in red). Again, whatâs the problem? Yep, there are only 3 listings, an unreliable sample size. So, what are you to do? All of your âanswersâ just got blown out of the water! Does this mean that all of the answers in that Findings Window chart are unreliable? No, it doesnât. The end hour results simply provide you with the ending times that have the highest LSR, highest ASP, and the best combination without taking sample size into account. With your more advanced brainpower, you can quickly and easily check these answers and find times that are proven. Check out the three times I underlined in blue. These times have decent sample sizes, good success rates, and respectable prices (or high prices for the last two), and they only took me about 5 seconds to pick out. You can do it too! The chart in the Findings Window is a great place to start getting answers on how you can make more money with the products you already have. It sometimes does require a little double checking, but the Summary Window makes it easy for you to make sure the answers youâre looking at are proven and reliable (and to find new answers when they arenât). Take a minute and go through the rest of the Findings chart and see what other answers you can find for our Skullcandy earbuds, and Iâll see you in our next lesson where weâll talk about other ways to increase our profits! Assignment #5: How can you improve your own listings? Now, Iâm sure youâre excited to try this out for your own products. Take a minute to conduct a Product Search on one of your own products (remember to check your research for accuracy!), and take a look at the chart in the Findings Window. Look at the column that fits your strategy, and use the Summary Window to ensure that youâre results are reliable and proven. What did you find out about how you can improve your listings? Pretty cool, right? CONGRATULATIONS! Youâve finished Lesson 5 (youâre half-way through the Power to Profit course! Can you believe it?), and youâve learned some great stuff about how to increase your profits. In our next lesson weâll talk about even more ways you can make more money. Remember to send your questions to our support team! Look for Lesson 6 in your inbox in a day or two. Or, if you can't wait, move forward to Lesson 6 right now. Or, return to Power to Profit Tutorial Home Page |
|||||
 People often ask whether X% is a good success
rate. There isnât a simple cut off that equals a good LSR. If you can
list the product more than one time and still make a profit, the answer
is yes. If your profit margin is too narrow to list the product
multiple times, then the answer might be no. It really depends on your
situation, the price you paid for the item, and how much the research
says you can make on it.
People often ask whether X% is a good success
rate. There isnât a simple cut off that equals a good LSR. If you can
list the product more than one time and still make a profit, the answer
is yes. If your profit margin is too narrow to list the product
multiple times, then the answer might be no. It really depends on your
situation, the price you paid for the item, and how much the research
says you can make on it.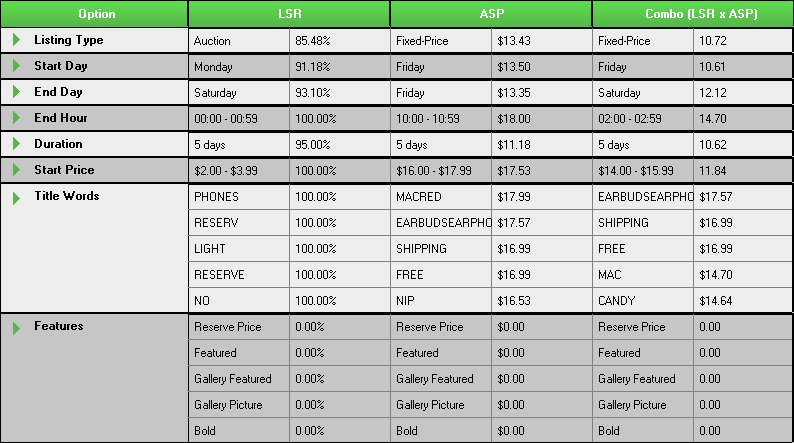
 at the
bottom of the page, and weâre going to check out the End
Hour table (either click the End Hour link at the top,
or scroll down until you see the table).
at the
bottom of the page, and weâre going to check out the End
Hour table (either click the End Hour link at the top,
or scroll down until you see the table).