 |
 |
 |
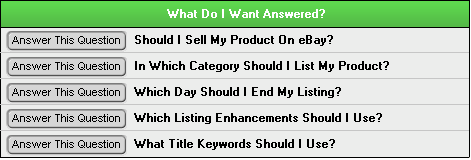
Lesson 6How Can I Quickly Make More Money With What I Already Have?Part 2: "Answer This Question"The last lesson was pretty awesome, huh? Thereâs so many ways you can optimize your listings to ensure youâre attracting the highest-paying buyers and maximizing your profits. But the best news is that we havenât even scratched the surface! Today, weâre going to cover a few more reports that will show you quickly and easily how to make even more money. In Lesson 5, we scrolled to the bottom of the Findings Window to find the chart that gave us so many ways to optimize our listings. However, on the way down, you might have noticed this section on the Findings Window, which poses several questions.
These are reports HammerTap automatically puts together for you, and each answers a very specific question. Weâll talk about each of these reports throughout the rest of this course, and, today, weâre going to cover the middle three. So, open up your saved Filtered Earbuds report and weâll get started! In Which Category Should I List My Product?Remember back to Lesson 2. We were deciding what to include in our search window and I mentioned that I wasnât going to search a specific category because I wanted to find the most profitable one. Well, this report is going to show me how the various categories I could list in will affect my listingâs profitability, which will make it really easy for me to pick the best one. Now, I know there are some of you who are wondering how the category could make a difference, since buyers all just use the search bar, right? Well, the search bar certainly is the most used search method; however, there are still buyers out there who browse through categories. And since it only takes one buyer to make your listing successful, do you want to take the risk that the highest-paying buyer for your item is only using the search bar? You have to pick a category for your item to list it on eBay, so why not pick one that will make you more successful? Letâs dive into this report. Click on
My report has 2 categories that have more than 10 listings in them (remember sample size).
These charts are only valuable if we remember that weâre trying to get our listingâs LSR and ASP above average. Remember that the overall LSR for our Skullcandy earbuds is 81.68% and our ASP is $12.13. Weâre using these numbers as benchmarks as we make decisions on how to optimize our listings. So, the first category, Electronics > iPod & MP3 Accessories > For iPod > Headphones & Earbuds, has a price that is $0.77 less than our overall average of $12.13 (marked in red) and a listing success rate that is 3.19% above our average (marked in green). The listings in the second category, Electronics > iPod & MP3 Accessories > For MP3 Players > Headphones & Earbuds, on average had a price $1.39 above the overall ASP, but had a LSR that was 5.86% less. Now, what do these numbers mean? Remember our selling strategies? Well, weâre not done with them yet! These tables give us the information we need to make a strategic decision. If I had a LSR strategy I would want to list in the first category because my product would have a greater chance of having a higher LSR. The second category would be a good choice if I had an ASP strategy. But what would you do if you wanted a middle of the road option? Thereâs no clear-cut answer for that one because neither of these categories have a really steep drop in either ASP or LSR, so itâd be a personal decision. What would you do? Which Day Should I End My Listing?In
the last lesson, when we looked at the Findings chart, I had you look
at the End Day option. This section of the
chart is a great resource and it helps you answer this question very
quickly, but if you want to examine the information a little closer,
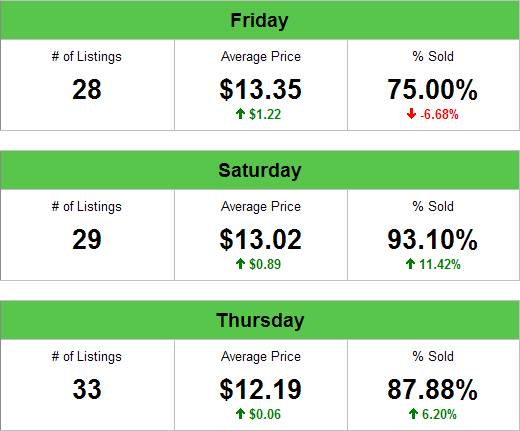
this is your report. Click One of the most useful features of this report is the sorting feature. You can sort by Days of the Week, # of Listings, Average Price, or % Sold. Each of these views will make it easy to make different conclusions. First, letâs figure out which day will get us the highest price. I sorted by Average Price and these are the top three days:
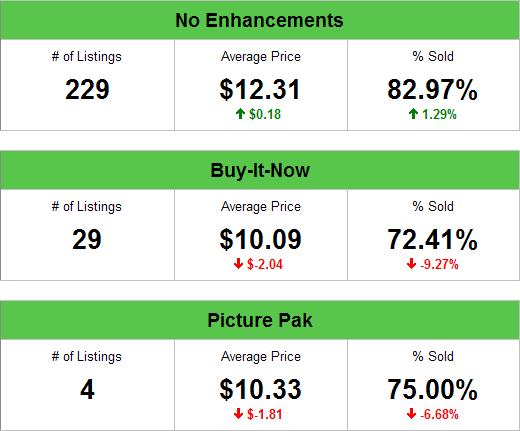
So, with no scrolling involved and only one click, I have the ending day that will give me the highest price! For an ASP strategy, Friday is the best choice. Now, if I sort the days by % Sold, Saturday and Thursday are still in the top three days, followed by Monday (which increases our LSR by 2.94%, but also decreases our price by $2.11). So, for a LSR strategy Saturday is our best choice. See how easy this is?! Sorting by # of Listings can also give you some great information. Weâve already talked about the importance of checking the number of listings to ensure that we have an adequate sample size. But you can also use the number of listings to check the level of competition for each day. If you wanted to find a day when your listings would have to compete with fewer competitorsâ listings, you could sort by this option and find the day with the least competition. Which Listing Enchancements Should I Use?Listings fees are just one of the costs of doing business on eBay, but that doesnât mean you donât want to keep them as low as possible. But how do you keep your costs low when youâre faced with so many choices when building your listings? Should you include Bold or Highlight? Is an extra picture worth it? Well, this final report weâre going to look at today helps you avoid unnecessary listing fees by showing you exactly which listing enhancements not only pay for themselves, but also increase your profits. Click Here are the listing enhancements my report included:
These were all of the listing enhancements that sellers of our product used. No one even used Bold or Highlight so we donât have any information on what they would do to our price or success rate.
But letâs examine the information we do have. The first chart shows us that using no enhancements might be the way to go, because these listings had no extra fees, and had higher sales prices and success rates than average. Next, we have the Buy-It-Now option. Within this report, Buy-It-Now refers to the opportunity sellers have to add a Buy-It-Now option to their auction-type listings. Adding this option costs a fee, and from looking at my report, I can see that this option definitely isnât worth it. Regardless of how much the fee is, the Buy-It-Now option is going to cost me money because itâs decreasing my sales price and my success rate, making this unquestionably an unnecessary fee. Our final table, gives information on the profitability of using the Picture Pak option (this enhancement allows you to add multiple pictures). Before we even look at the ASP and LSR, check the number of listings. There were only 4 listings that used this feature. Is that a good, reliable sample size? No. Even if the ASP and LSR had good news for us, we would want to be wary, because this information isnât proven. There werenât very many listing enhancements used in the listings my search pulled up. Did your report show more? What can you learn for your report? If youâd like more information on using this report to avoid unnecessary listing fees, check out this article or this video tutorial. Putting it Into PracticeNow you know exactly how to use the Findings Window to quickly increase your profits! Youâre a pro at using the Findings chart after Lesson 5, and now you know how to quickly and easily choose the most profitable category, the best ending day, and how to avoid unnecessary listing fees by using the HammerTap question reports! Next time, weâll explore the Listings Window to find a few more quick ways we can increase our profits. Stay tuned! Assignment #6: What answers can you find for your own products? I bet you know what Iâm going to ask you to do, huh? Well, get on it! Check out how much more money you can make on your own products by looking at the HammerTap question reports. You can either run a new Product Search or you can look at the reports within a saved search for one of your products. CONGRATULATIONS! Youâve finished yet another session! If you have any questions make sure you send them on to our support team so we can get them answered for you! Look for Lesson 7 in your inbox in a day or two. Or, if you can't wait, move forward to Lesson 7 right now. Or, return to Power to Profit Tutorial Home Page |
|||||
 , and
weâll take a look.
, and
weâll take a look.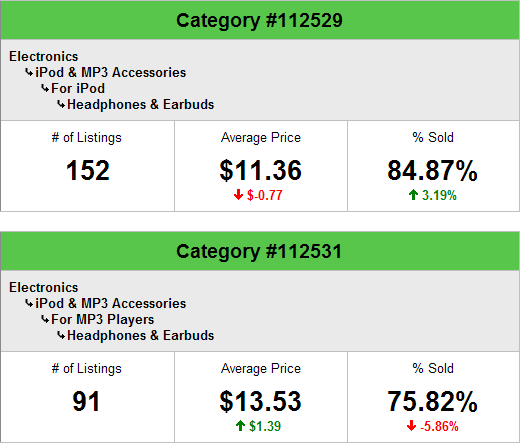
 If we had a little bit of room for
experimentation, using the Bold or Highlight features when selling our
earbuds could be good ways to stand out from the competition, since no
other sellers are using these enhancements.
If we had a little bit of room for
experimentation, using the Bold or Highlight features when selling our
earbuds could be good ways to stand out from the competition, since no
other sellers are using these enhancements.